") prometheus下載安裝教程
prometheus下載安裝教程
Prometheus 是一個(gè)開放性的監(jiān)控解決方案,用戶可以非常方便的安裝和使用 Prometheus 并且能夠非常方便的對(duì)其進(jìn)行擴(kuò)展。
在Prometheus的架構(gòu)設(shè)計(jì)中,Prometheus Server 并不直接服務(wù)監(jiān)控特定的目標(biāo),其主要任務(wù)負(fù)責(zé)數(shù)據(jù)的收集,存儲(chǔ)并且對(duì)外提供數(shù)據(jù)查詢支持。因此為了能夠能夠監(jiān)控到某些東西,如主機(jī)的CPU使用率,我們需要使用到Exporter。Prometheus周期性的從Exporter暴露的HTTP服務(wù)地址(通常是/metrics)拉取監(jiān)控樣本數(shù)據(jù)。
Exporter可以是一個(gè)相對(duì)開放的概念,其可以是一個(gè)獨(dú)立運(yùn)行的程序獨(dú)立于監(jiān)控目標(biāo)以外,也可以是直接內(nèi)置在監(jiān)控目標(biāo)中。只要能夠向Prometheus提供標(biāo)準(zhǔn)格式的監(jiān)控樣本數(shù)據(jù)即可。
1 環(huán)境配置
我們在 Windows 下安裝 Prometheus。
1.1 安裝 Prometheus
下載地址:https://prometheus.io/download/
選擇 Windows 安裝包,我選擇的是prometheus-2.41.0.windows-amd64, 下載完成后解壓,直接運(yùn)行 prometheus.exe 即可。
prometheus默認(rèn)端口是9090,在瀏覽器訪問:http://localhost:9090,即可看到項(xiàng)目已經(jīng)在運(yùn)行。

Prometheus 的相關(guān)配置可以在 prometheus.yaml 中修改。
1.2 安裝 NodeExporter
NodeExporter 是 Prometheus 提供的一個(gè)可以采集到主機(jī)信息的應(yīng)用程序,它能采集到機(jī)器的 CPU、內(nèi)存、磁盤等信息。
下載地址: https://prometheus.io/download/
選擇 Windows 版本,我選擇的是windows_exporter-0.20.0-amd64,下載完成后直接運(yùn)行 windows_exporter-0.20.0-amd64.exe 文件即可。
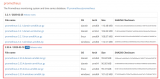
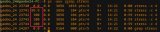
windows_exporter默認(rèn)端口是9182,通過瀏覽器訪問:http://localhost:9182/metrics,

可以看到當(dāng)前 node exporter 獲取到的當(dāng)前主機(jī)的所有監(jiān)控?cái)?shù)據(jù)。 其中 HELP 用于解釋當(dāng)前指標(biāo)的含義,TYPE 則說明當(dāng)前指標(biāo)的數(shù)據(jù)類型。
2 添加數(shù)據(jù)源
編輯 prometheus 的配置文件 prometheus.yml,將scrape_configs修改為如下內(nèi)容:
scrape_configs:

  - job_name: "prometheus"
    static_configs:
      - targets: ["localhost:9090"]

  # node exporter 監(jiān)控源
  - job_name: 'prometheus2'
    static_configs:
      - targets: ['localhost:8080']
即配置了兩個(gè)任務(wù)。一個(gè)名為 prometheus,其從「localhost:9090」地址讀取數(shù)據(jù)。另一個(gè)名為 prometheus2,其從「localhost:8080」地址讀取數(shù)據(jù)。 然后重啟 Prometheus。
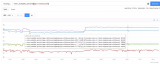
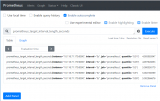
瀏覽器訪問:http://localhost:9090,在搜索框輸入up,點(diǎn)擊execute,即可看到我們配置的兩個(gè)任務(wù):

3 自定義寫入的數(shù)據(jù)
新建 SpringBoot 項(xiàng)目。完整項(xiàng)目地址:
GitHub地址:https://github.com/Snowstorm0/learn-prometheus
Gitee地址:https://gitee.com/Snowstorm0/learn-prometheus
在 service 層編寫插入數(shù)據(jù)的代碼:
public void insertPrometheus() {
    meterRegistry.clear();
    setIdList();
    setNameMap();
    setValueMap();
    for (String id : idList) {
        List
在 controller 層編寫讀取的代碼:
@RequestMapping(value = "/metric/custom", method = RequestMethod.GET,produces = "text/plain; charset=utf-8")
public Object metric() {
	return prometheusMeterRegistry.scrape();
}
用瀏覽器或者Postman訪問: http://localhost:8081/metric/custom
可以看到寫入的數(shù)據(jù):
# HELP insertPrometheus
# TYPE insertPrometheus gauge
insertPrometheus{id="1002",name="錢二",} 1002.0
insertPrometheus{id="1001",name="趙一",} 1001.0
insertPrometheus{id="1003",name="孫三",} 1003.0
這里的數(shù)據(jù)是放在本地的,可以供 Prometheus 讀取。
4 更新數(shù)據(jù)
在 service 層編寫插入數(shù)據(jù)的代碼:
public void updatePrometheus() {
    String name = "updatePrometheus";
    List
用瀏覽器或者Postman訪問: http://localhost:8081/metric/custom
可以看到寫入的數(shù)據(jù):
updatePrometheus{id="1001",name="測試更新",} 1.0
學(xué)習(xí)更多編程知識(shí),請(qǐng)關(guān)注我的公眾號(hào):
[代碼的路]
-
JAVA
+關(guān)注
關(guān)注
20文章
2987瀏覽量
107317 -
Prometheus
+關(guān)注
關(guān)注
0文章
30瀏覽量
1863
發(fā)布評(píng)論請(qǐng)先 登錄
詳解Prometheus的數(shù)據(jù)類型
使用Prometheus與Grafana實(shí)現(xiàn)MindIE服務(wù)可視化監(jiān)控功能
Keil uVision 5安裝包下載,詳細(xì)安裝教程~
Multisim 14 下載安裝教程,親測可用,永久免費(fèi)
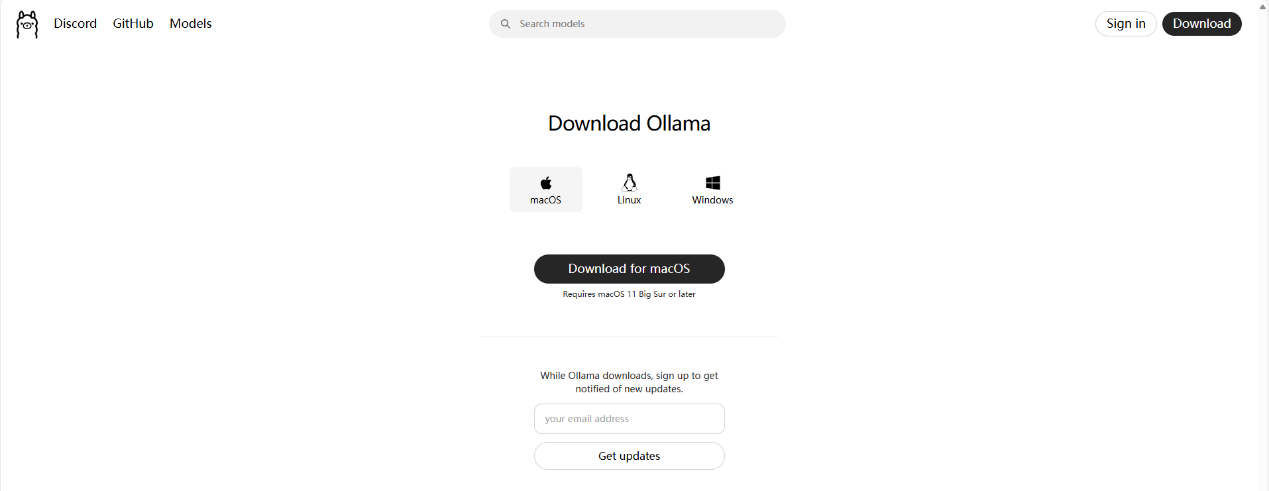
在MAC mini4上安裝Ollama、Chatbox及模型交互指南
STM32WB09的開發(fā)板下載藍(lán)牙的程序之后,手機(jī)的藍(lán)牙檢測不到是為什么?
從零入門Prometheus:構(gòu)建企業(yè)級(jí)監(jiān)控與報(bào)警系統(tǒng)的最佳實(shí)踐指南
阿里云官網(wǎng)電腦版,阿里云電腦版的下載使用教程

單獨(dú)下載安裝adcpro后運(yùn)行adcpro.exe并安裝ADS1256PDK的plug-ing后連接開發(fā)板總是提示錯(cuò)誤,為什么?
linux下服務(wù)器穩(wěn)定性壓?測試?具stress安裝使?介紹
請(qǐng)問mateXT鴻蒙 4.2.0.130, 如何可以安裝并正常使用goople play store?
Xilinx_Vivado_SDK的安裝教程


 工商網(wǎng)監(jiān)
評(píng)論