“前視圖”投影
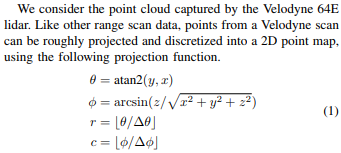
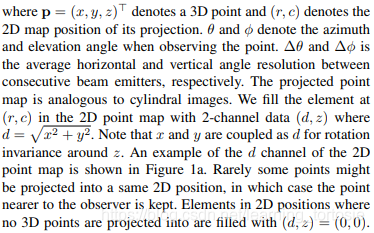
為了將激光雷達(dá)傳感器的“前視圖”展平為2D圖像,必須將3D空間中的點(diǎn)投影到可以展開的圓柱形表面上,以形成平面。
本文代碼參考自論文《Vehicle Detection from 3D Lidar Using Fully Convolutional Network》
論文鏈接:https://arxiv.org/pdf/1608.07916.pdf


# h_res = horizontal resolution of the lidar sensor
# v_res = vertical resolution of the lidar sensor
x_img = arctan2(y_lidar, x_lidar)/ h_res
y_img=np.arctan2(z_lidar,np.sqrt(x_lidar**2+y_lidar**2))/v_res
問題在于這樣做會將圖像的接縫直接放在汽車的右側(cè)。將接縫定位在汽車的最后部更有意義,因此前部和側(cè)部更重要的區(qū)域是不間斷的。讓這些重要區(qū)域不間斷將使卷積神經(jīng)網(wǎng)絡(luò)更容易識別那些重要區(qū)域中的整個對象。
以下代碼解決了這個問題。
# h_res = horizontal resolution of the lidar sensor
# v_res = vertical resolution of the lidar sensor
x_img = np.arctan2(-y_lidar, x_lidar)/ h_res # seam in the back
y_img=np.arctan2(z_lidar,np.sqrt(x_lidar**2+y_lidar**2))/v_res
沿每個軸配置刻度
變量h r e s h_{res}和v r e s v_{res}非常依賴于所使用的LIDAR傳感器。在KTTI數(shù)據(jù)集中,使用的傳感器是Velodyne HDL 64E。根據(jù)Velodyne HDL 64E的規(guī)格表,它具有以下重要特征:
-
垂直視野為26.9度,分辨率為0.4度,垂直視野被分為傳感器上方+2度,傳感器下方-24.9度
-
360度的水平視野,分辨率為0.08-0.35(取決于旋轉(zhuǎn)速度)
-
旋轉(zhuǎn)速率可以選擇在5-20Hz之間
可以按以下方式更新代碼:
# Resolution and Field of View of LIDAR sensor
h_res = 0.35         # horizontal resolution, assuming rate of 20Hz is used
v_res = 0.4          # vertical res
v_fov = (-24.9, 2.0) # Field of view (-ve, +ve) along vertical axis
v_fov_total = -v_fov[0] + v_fov[1]


# Convert to Radians
v_res_rad = v_res * (np.pi/180)
h_res_rad = h_res * (np.pi/180)


# Project into image coordinates
x_img = np.arctan2(-y_lidar, x_lidar)/ h_res_rad
y_img=np.arctan2(z_lidar,d_lidar)/v_res_rad
然而,這導(dǎo)致大約一半的點(diǎn)在x軸負(fù)方向上,并且大多數(shù)在y軸負(fù)方向上。為了投影到2D圖像,需要將最小值設(shè)置為(0,0),所以需要做一些改變:
# SHIFT COORDINATES TO MAKE 0,0 THE MINIMUM
x_min = -360.0/h_res/2    # Theoretical min x value based on specs of sensor
x_img = x_img - x_min     # Shift
x_max = 360.0/h_res       # Theoretical max x value after shifting


y_min = v_fov[0]/v_res    # theoretical min y value based on specs of sensor
y_img = y_img - y_min     # Shift
y_max = v_fov_total/v_res # Theoretical max x value after shifting
y_max = y_max + 5         # UGLY: Fudge factor because the calculations based on
                          # spec sheet do not seem to match the range of angles
#collectedbysensorinthedata.
繪制二維圖像
將3D點(diǎn)投影到2D坐標(biāo)點(diǎn),最小值為(0,0),可以將這些點(diǎn)數(shù)據(jù)繪制成2D圖像。
pixel_values = -d_lidar # Use depth data to encode the value for each pixel
cmap = "jet"            # Color map to use
dpi = 100               # Image resolution
fig, ax = plt.subplots(figsize=(x_max/dpi, y_max/dpi), dpi=dpi)
ax.scatter(x_img,y_img, s=1, c=pixel_values, linewidths=0, alpha=1, cmap=cmap)
ax.set_axis_bgcolor((0, 0, 0)) # Set regions with no points to black
ax.axis('scaled')              # {equal, scaled}
ax.xaxis.set_visible(False)    # Do not draw axis tick marks
ax.yaxis.set_visible(False)    # Do not draw axis tick marks
plt.xlim([0, x_max])   # prevent drawing empty space outside of horizontal FOV
plt.ylim([0, y_max])   # prevent drawing empty space outside of vertical FOV
fig.savefig("/tmp/depth.png",dpi=dpi,bbox_inches='tight',pad_inches=0.0)
完整代碼
把上面所有的代碼放在一個函數(shù)中。
def lidar_to_2d_front_view(points,
                           v_res,
                           h_res,
                           v_fov,
                           val="depth",
                           cmap="jet",
                           saveto=None,
                           y_fudge=0.0
                           ):
    """ Takes points in 3D space from LIDAR data and projects them to a 2D
        "front view" image, and saves that image.


    Args:
        points: (np array)
            The numpy array containing the lidar points.
            The shape should be Nx4
            - Where N is the number of points, and
            - each point is specified by 4 values (x, y, z, reflectance)
        v_res: (float)
            vertical resolution of the lidar sensor used.
        h_res: (float)
            horizontal resolution of the lidar sensor used.
        v_fov: (tuple of two floats)
            (minimum_negative_angle, max_positive_angle)
        val: (str)
            What value to use to encode the points that get plotted.
            One of {"depth", "height", "reflectance"}
        cmap: (str)
            Color map to use to color code the `val` values.
            NOTE: Must be a value accepted by matplotlib's scatter function
            Examples: "jet", "gray"
        saveto: (str or None)
            If a string is provided, it saves the image as this filename.
            If None, then it just shows the image.
        y_fudge: (float)
            A hacky fudge factor to use if the theoretical calculations of
            vertical range do not match the actual data.


            For a Velodyne HDL 64E, set this value to 5.
    """


    # DUMMY PROOFING
    assert len(v_fov) ==2, "v_fov must be list/tuple of length 2"
    assert v_fov[0] <= 0, "first element in v_fov must be 0 or negative"
    assert val in {"depth", "height", "reflectance"},
        'val must be one of {"depth", "height", "reflectance"}'


    x_lidar = points[:, 0]
    y_lidar = points[:, 1]
    z_lidar = points[:, 2]
    r_lidar = points[:, 3] # Reflectance
    # Distance relative to origin when looked from top
    d_lidar = np.sqrt(x_lidar ** 2 + y_lidar ** 2)
    # Absolute distance relative to origin
    # d_lidar = np.sqrt(x_lidar ** 2 + y_lidar ** 2, z_lidar ** 2)


    v_fov_total = -v_fov[0] + v_fov[1]


    # Convert to Radians
    v_res_rad = v_res * (np.pi/180)
    h_res_rad = h_res * (np.pi/180)


    # PROJECT INTO IMAGE COORDINATES
    x_img = np.arctan2(-y_lidar, x_lidar)/ h_res_rad
    y_img = np.arctan2(z_lidar, d_lidar)/ v_res_rad


    # SHIFT COORDINATES TO MAKE 0,0 THE MINIMUM
    x_min = -360.0 / h_res / 2  # Theoretical min x value based on sensor specs
    x_img -= x_min              # Shift
    x_max = 360.0 / h_res       # Theoretical max x value after shifting


    y_min = v_fov[0] / v_res    # theoretical min y value based on sensor specs
    y_img -= y_min              # Shift
    y_max = v_fov_total / v_res # Theoretical max x value after shifting


    y_max += y_fudge            # Fudge factor if the calculations based on
                                # spec sheet do not match the range of
                                # angles collected by in the data.


    # WHAT DATA TO USE TO ENCODE THE VALUE FOR EACH PIXEL
    if val == "reflectance":
        pixel_values = r_lidar
    elif val == "height":
        pixel_values = z_lidar
    else:
        pixel_values = -d_lidar


    # PLOT THE IMAGE
    cmap = "jet"            # Color map to use
    dpi = 100               # Image resolution
    fig, ax = plt.subplots(figsize=(x_max/dpi, y_max/dpi), dpi=dpi)
    ax.scatter(x_img,y_img, s=1, c=pixel_values, linewidths=0, alpha=1, cmap=cmap)
    ax.set_axis_bgcolor((0, 0, 0)) # Set regions with no points to black
    ax.axis('scaled')              # {equal, scaled}
    ax.xaxis.set_visible(False)    # Do not draw axis tick marks
    ax.yaxis.set_visible(False)    # Do not draw axis tick marks
    plt.xlim([0, x_max])   # prevent drawing empty space outside of horizontal FOV
    plt.ylim([0, y_max])   # prevent drawing empty space outside of vertical FOV


    if saveto is not None:
        fig.savefig(saveto, dpi=dpi, bbox_inches='tight', pad_inches=0.0)
    else:
fig.show()
以下是一些用例:
import matplotlib.pyplot as plt
import numpy as np


HRES = 0.35         # horizontal resolution (assuming 20Hz setting)
VRES = 0.4          # vertical res
VFOV = (-24.9, 2.0) # Field of view (-ve, +ve) along vertical axis
Y_FUDGE = 5         # y fudge factor for velodyne HDL 64E


lidar_to_2d_front_view(lidar, v_res=VRES, h_res=HRES, v_fov=VFOV, val="depth",
                       saveto="/tmp/lidar_depth.png", y_fudge=Y_FUDGE)


lidar_to_2d_front_view(lidar, v_res=VRES, h_res=HRES, v_fov=VFOV, val="height",
                       saveto="/tmp/lidar_height.png", y_fudge=Y_FUDGE)


lidar_to_2d_front_view(lidar, v_res=VRES, h_res=HRES, v_fov=VFOV,
                       val="reflectance", saveto="/tmp/lidar_reflectance.png",
                       y_fudge=Y_FUDGE)
產(chǎn)生以下三個圖像:
Depth

Height

Reflectance

后續(xù)操作步驟
目前創(chuàng)建每個圖像非常慢,可能是因?yàn)閙atplotlib,它不能很好地處理大量的散點(diǎn)。
因此需要創(chuàng)建一個使用numpy或PIL的實(shí)現(xiàn)。
測試
需要安裝python-pcl,加載PCD文件。
sudo apt-get install python-pip


sudo apt-get install python-dev


sudo pip install Cython==0.25.2


sudo pip install numpy


sudo apt-get install git


git clone https://github.com/strawlab/python-pcl.git


cd python-pcl/


python setup.py build_ext -i


python setup.py install
可惜,sudo pip install Cython==0.25.2這步報(bào)錯:
“Cannot uninstall ‘Cython’. It is a distutils installed project and thus we cannot accurately determine which files belong to it which would lead to only a partial uninstall.”
換個方法,安裝pypcd:
pipinstallpypcd
查看 https://pypi.org/project/pypcd/ ,用例如下:
Example
-------


.. code:: python


import pypcd
# also can read from file handles.
pc = pypcd.PointCloud.from_path('foo.pcd')
# pc.pc_data has the data as a structured array
# pc.fields, pc.count, etc have the metadata


# center the x field
pc.pc_data['x'] -= pc.pc_data['x'].mean()


# save as binary compressed
pc.save_pcd('bar.pcd', compression='binary_compressed')
測試數(shù)據(jù)結(jié)構(gòu):
“ >>> lidar = pypcd.PointCloud.from_path(‘~/pointcloud-processing/000000.pcd’)
>>> lidar.pc_data
array([(18.323999404907227, 0.04899999871850014, 0.8289999961853027, 0.0),
(18.3439998626709, 0.10599999874830246, 0.8289999961853027, 0.0),
(51.29899978637695, 0.5049999952316284, 1.944000005722046, 0.0),
…,
(3.7139999866485596, -1.3910000324249268, -1.7330000400543213, 0.4099999964237213),
(3.9670000076293945, -1.4739999771118164, -1.8569999933242798, 0.0),
(0.0, 0.0, 0.0, 0.0)],
dtype=[(‘x’, ‘
>>> lidar.pc_data[‘x’]
array([ 18.3239994 , 18.34399986, 51.29899979, …, 3.71399999,
3.96700001, 0. ], dtype=float32) ”
加載PCD:
import pypcd


lidar=pypcd.PointCloud.from_path('000000.pcd')
x_lidar:
x_lidar=points[’x‘]
結(jié)果:
Depth

Height

Reflectance

-
傳感器
+關(guān)注
關(guān)注
2564文章
52702瀏覽量
764598 -
變量
+關(guān)注
關(guān)注
0文章
614瀏覽量
28857 -
激光雷達(dá)
+關(guān)注
關(guān)注
971文章
4210瀏覽量
192216
原文標(biāo)題:點(diǎn)云處理——將激光雷達(dá)數(shù)據(jù)投影到二維圖像
文章出處:【微信號:vision263com,微信公眾號:新機(jī)器視覺】歡迎添加關(guān)注!文章轉(zhuǎn)載請注明出處。
發(fā)布評論請先 登錄
激光雷達(dá)是自動駕駛不可或缺的傳感器
激光雷達(dá)分類以及應(yīng)用
激光雷達(dá)面臨的機(jī)遇與挑戰(zhàn)
北醒固態(tài)設(shè)計(jì)激光雷達(dá)
固態(tài)設(shè)計(jì)激光雷達(dá)
激光雷達(dá)除了可以激光測距外,還可以怎么應(yīng)用?
激光雷達(dá)知多少:從技術(shù)上講講未來前景
一種不依賴于棋盤格等輔助標(biāo)定物體實(shí)現(xiàn)像素級相機(jī)和激光雷達(dá)自動標(biāo)定的方法
如何設(shè)計(jì)一款適合于果園應(yīng)用的激光雷達(dá)
激光雷達(dá)點(diǎn)云數(shù)據(jù)分割算法的嵌入式平臺上的部署實(shí)現(xiàn)
激光雷達(dá)點(diǎn)云數(shù)據(jù)

詳解激光雷達(dá)點(diǎn)云數(shù)據(jù)的處理過程
瑞識科技推出用于激光雷達(dá)的二維可尋址VCSEL芯片并獲量產(chǎn)訂單


 點(diǎn)云處理——將激光雷達(dá)數(shù)據(jù)投影到二維圖像


評論